Sales Price Finder
The Sales Price Finder helps sellers determine optimal pricing for parts they intend to sell. Based on market data, the FMV, and company-specific pricing rules (minimum sales prices and margins), it calculates a pricing corridor from break-even to opening price and AOG premium.
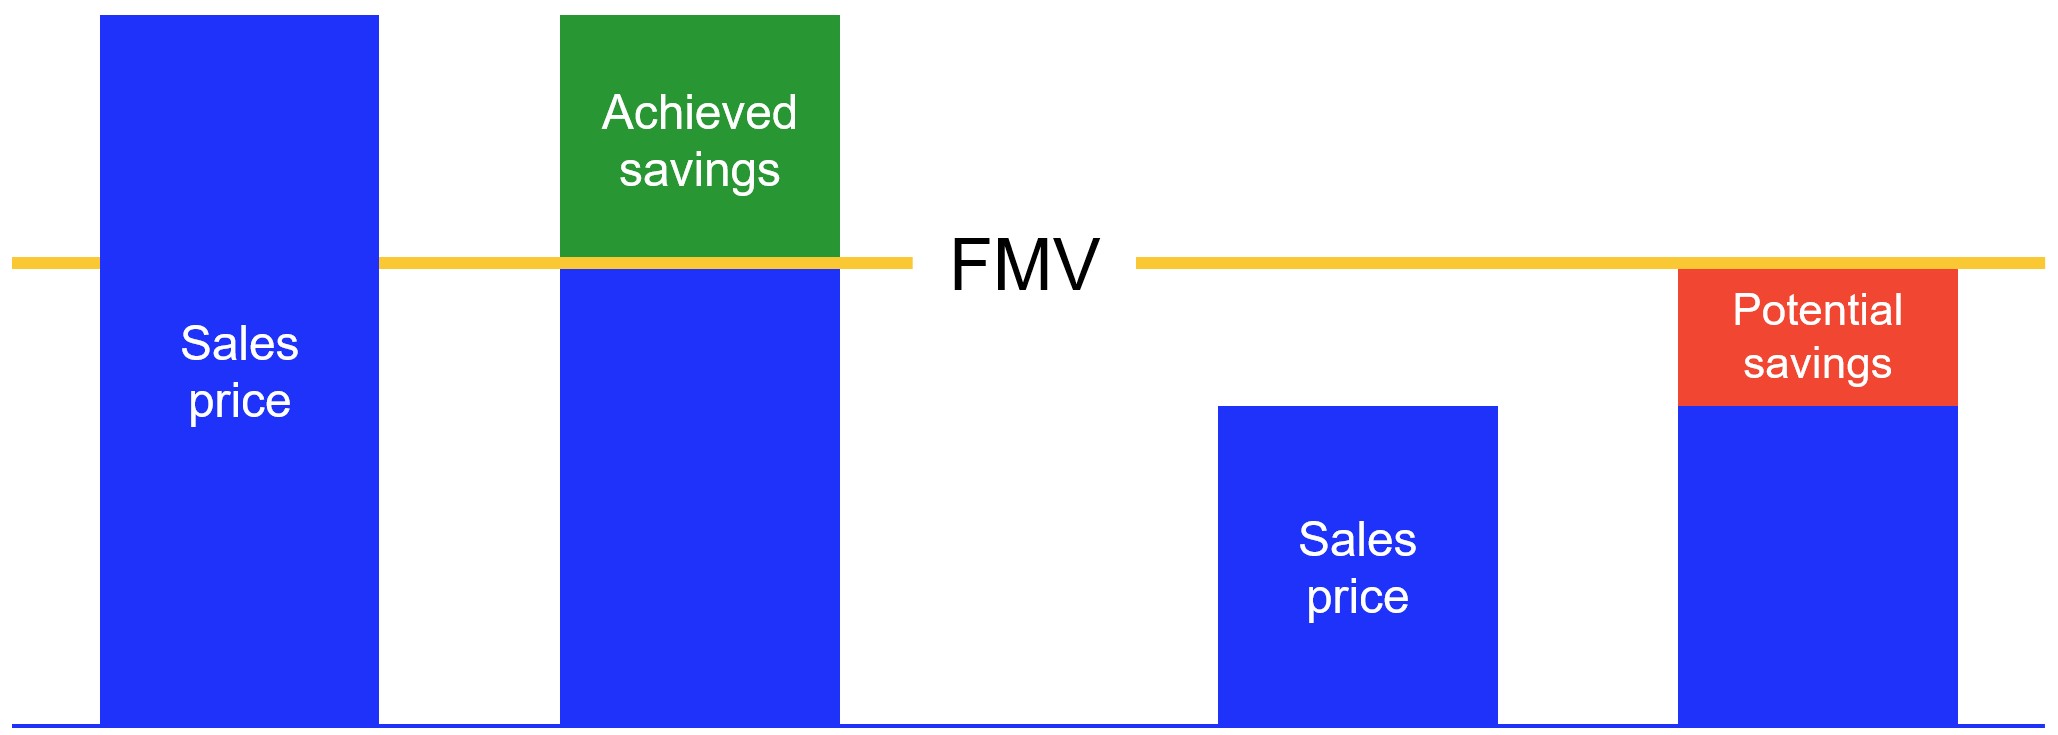
Selling above the FMV realises achieved savings; selling below it leaves potential savings on the table. The Sales Price Finder builds a corridor that keeps the offer inside the market band.
Input parameters
Two parameters are required, one is optional:
Part number (required) — autocomplete search across all known part numbers
Material condition (required) — select from the standard condition list
Serial number (optional) — if provided, the system checks for serial-specific pricing rules set up by the company
After entering these details, initiate the search by pressing “Enter” or clicking the “Find Price” button.

Results
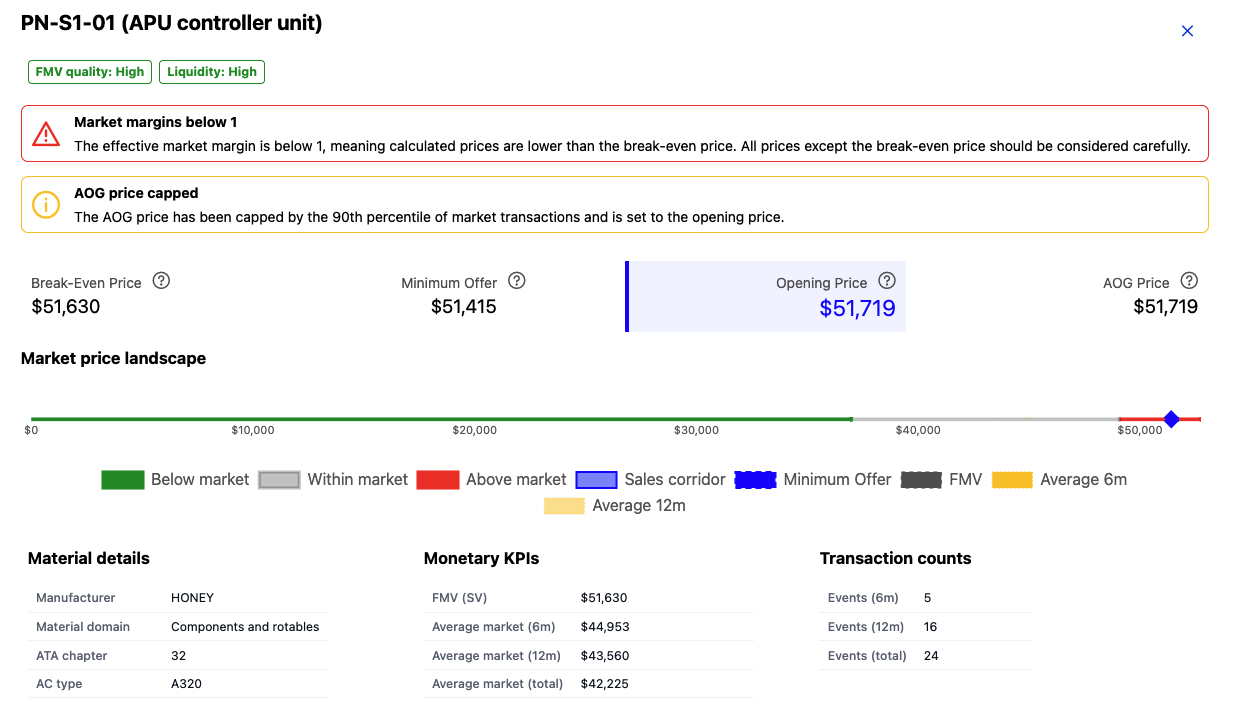
The results screen shows quality indicators, a pricing corridor with four recommended price points, a market price landscape chart, and detailed material and transaction data.
Quality indicators
Two quality indicators are shown at the top of the results:
FMV Quality — rated as High (stage 1-2), Medium (stage 3-4), or Low (stage 5+) based on the FMV stage for the part and condition. Higher quality means more transaction data supports the valuation.
Liquidity — rated as High, Medium, or Low based on the number of recent transactions. Higher liquidity indicates an active market for the part.
Note
For consumable and expendable parts (CUE domain), the FMV data may be limited as these parts have different market dynamics. A notice is shown in these cases.
Note
When the FMV quality is low (stage 5 or higher), results should be interpreted with caution as insufficient data is available for a reliable valuation.
Pricing corridor
Four price recommendations are displayed as cards:
Break-Even Price — the lowest acceptable selling price. This is based on the company’s Minimum Sales Price (MSP) if configured, or the FMV otherwise. Selling below this price would result in a loss relative to the reference.
Minimum Offer — the lowest recommended price to offer. Derived from the company’s configured sales margins or, when no company-specific margins exist, from industry-level pricing factors.
Opening Price — the recommended starting price for negotiations. This is the primary recommendation and is visually highlighted. Calculated from the company’s initial margin or industry factors.
AOG Price — the premium price applicable for Aircraft-on-Ground situations. Capped at the 90th percentile of market transactions to remain within market bounds, but at least as high as the opening price.
The pricing corridor uses company-specific data when available. Companies can configure their own minimum sales prices and margin levels in the settings. When no company-specific configuration exists, industry-level pricing factors derived from the IATA MRO SmartHub community database are applied.
How the corridor is resolved
The MSP and the three margins (min, initial, AOG) are resolved through a four-tier fallback.
Each tier fills only the values the higher tiers left blank, so a partial per-part rule never blocks a
lower tier from supplying the missing margins.
Tier |
Scope |
Source |
Typical use |
|---|---|---|---|
1 |
This company, this part, this condition, this serial number |
|
A specific unit with a known history (e.g. life-limited part with cycles remaining) that warrants an individual price floor. |
2 |
This company, this part, this condition |
|
The default policy for a given PN/condition. Applies to every serial of the part unless a serial-specific row overrides it. |
3 |
This company, this condition, all parts |
|
“Sell OH parts at ≥ 12 % / start negotiating at 18 % / AOG at 35 %.” Applies to every PN in that condition unless a per-part row wins. |
4 |
This company, any condition, all parts |
|
The company’s baseline margin policy, used when no more specific rule is configured. Set-and-forget for tenants that trade on a flat margin. |
— |
Community fallback |
|
Industry-derived factors from the IATA MRO SmartHub community, used only when no company tier supplies a value. |
Only margins live in company_pricing_defaults — MSP is intentionally not stored there, because a company-wide MSP has no defensible semantics (MSP is a per-part floor).
Market price landscape
This chart visualises the pricing corridor in the context of the overall market. Three market zones are shown:
Green area — prices below the average market level (below the 10th percentile).
Red area — prices above the average market level (above the 90th percentile).
Grey area — prices within the average market level.
The sales corridor is overlaid on the chart, showing the range from break-even to opening price. Additional reference lines show:
FMV — the Fair Market Value for the part and condition.
Average 6 months — the average transaction price over the last 6 months (if available).
Average 12 months — the average transaction price over the last 12 months (if available).
Material details
A table with the part’s static attributes:
Manufacturer
Material domain (rotable, repairable, consumable, expendable)
ATA chapter
Aircraft type
Monetary KPIs
A table with the key valuation metrics:
FMV — the Fair Market Value in the selected condition
Average market price — across all available transaction data
Average 6 months — average price over the last 6 months
Average 12 months — average price over the last 12 months
Transaction counts
A table showing the volume of market activity:
Events (6 months) — number of transactions in the last 6 months
Events (12 months) — number of transactions in the last 12 months
Events (total) — total number of transactions in the database