PMA Usage
The PMA Usage dashboard helps airline procurement and engineering teams
quantify their exposure to PMA (Parts Manufacturer Approval) parts and the
savings opportunity that exposure represents. The page is available under
Evaluator → PMA Usage for airlines whose contract includes the
evaluator_pma_stats authorization.
PMA detection is based on the FAA database. The underlying transaction universe is identical to the one driving the Evaluator FMV and benchmark features — only part numbers with FMV stages 1 to 4 contribute.
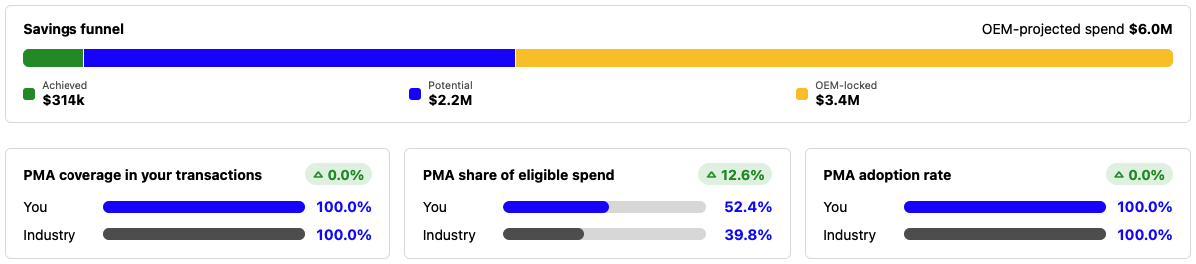
Top of the PMA Usage page: the savings funnel and the three headline comparison cards.
Data refresh
All KPIs displayed on the page are precomputed by a scheduled job that runs on the first day of every month. The current month is therefore included only once it has been fully closed.
The page shows a fixed window of the last 24 months — there is no on-page time-window selector, and opening the page never triggers a recalculation. The exact window is restated in the page subtitle (e.g. Calculation period: last 24 months (Jun 2024 – May 2026)).
Note
Fleet-applicability filtering — a “My fleet” view that would narrow the universe to part numbers relevant to the airline’s own fleet — is reserved for a follow-up release and is not yet available.
Savings funnel
The funnel sits at the top of the page and breaks the airline’s OEM-projected spend into three segments. OEM-projected spend is what the airline would have paid if every eligible purchase had been made at OEM list price — that is, eligible spend plus the PMA savings already realised. It is shown in the card header, and the three segments below always sum to it:
- Achieved:
Realised savings, shown in green. For every PMA purchase, the difference between the OEM FMV (at the matching condition) and the actual unit price, multiplied by quantity.
- Potential:
Theoretical savings still on the table, shown in blue. For every OEM-direct purchase, the difference between the actual unit price and the lowest available PMA FMV (at the matching condition), multiplied by quantity. Combines purchase- and repair-side potential.
- OEM-locked:
Residual eligible spend that is neither captured nor reachable through the current PMA registry — typically because there is no PMA FMV available at the relevant condition. Shown in yellow.
Note
Savings figures are theoretical and reflect price differences only. They do not account for contractual, regulatory or operational constraints that may prevent a switch from OEM to PMA in practice.
Headline comparison cards
Directly beneath the funnel, three side-by-side cards benchmark the airline against the industry. Each card shows a You bar and an Industry bar on the same 0–100 % scale, plus a Δ badge giving the difference in percentage points. “Industry” is computed across all MRO SmartHub contributors.
- PMA coverage in your transactions:
Share of distinct part numbers purchased by the airline that have at least one PMA alternative on file. A positive Δ means above-average PMA exposure; a negative Δ flags less exposure than the industry.
- PMA share of eligible spend:
Share of the airline’s eligible spend that went to PMA replacements.
- PMA adoption rate:
Share of eligible OEM part numbers for which at least one PMA purchase exists in the window.
PMA share breakdown
A horizontal stacked-bar chart shows, for each material domain, how its OEM-projected spend splits across the same three savings categories, expressed as percentages and normalised to 100 % per row:
Achieved (green) — share of OEM-projected spend already captured as savings via PMA purchases
Pot. purchase (blue) — share still capturable by switching OEM purchases to the cheapest PMA
OEM-locked (yellow) — share already paid at OEM prices with no remaining PMA savings reachable
The chart lists the top 12 material domains by OEM-projected spend, largest first, with domain names spelled out (e.g. Engines, Components and rotables).
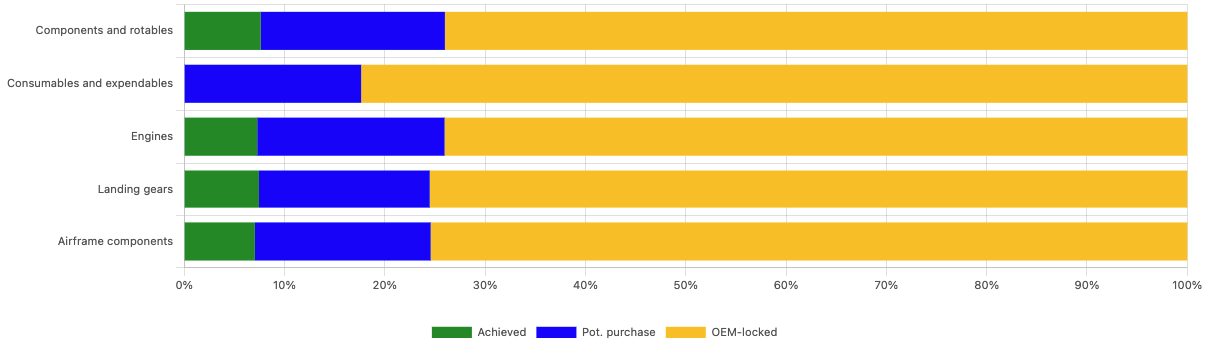
PMA share breakdown by material domain.
PMA adoption trend
A line chart plots the monthly PMA share of eligible spend — the share of the airline’s eligible spend that went to PMA replacements in each month. The vertical axis is labelled Share of eligible spend.
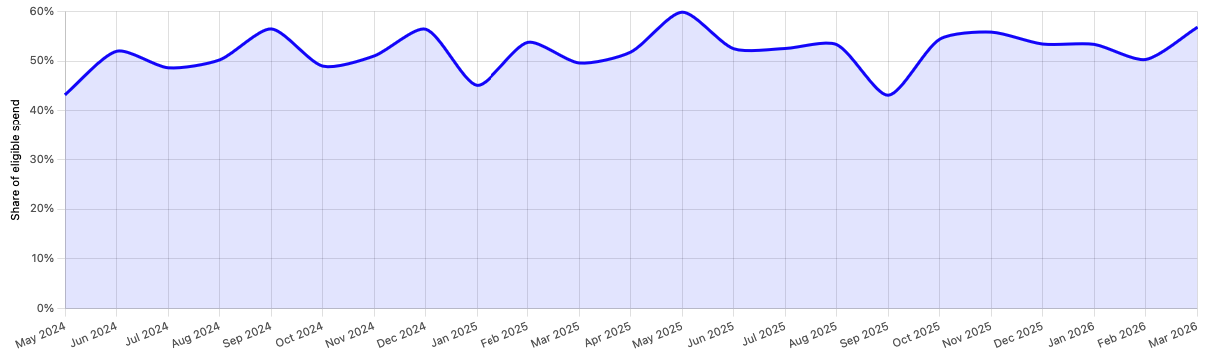
Monthly PMA share of eligible spend.
Monthly Overview
A monthly stacked bar chart (USD) splits each month’s eligible spend into the same three components as the funnel:
Achieved — realised PMA savings
Pot. purchase — purchase-side untapped savings
OEM-locked — eligible spend with no PMA FMV available
Repair-side potential is currently negligible and is folded into the funnel’s Potential segment rather than charted separately here.
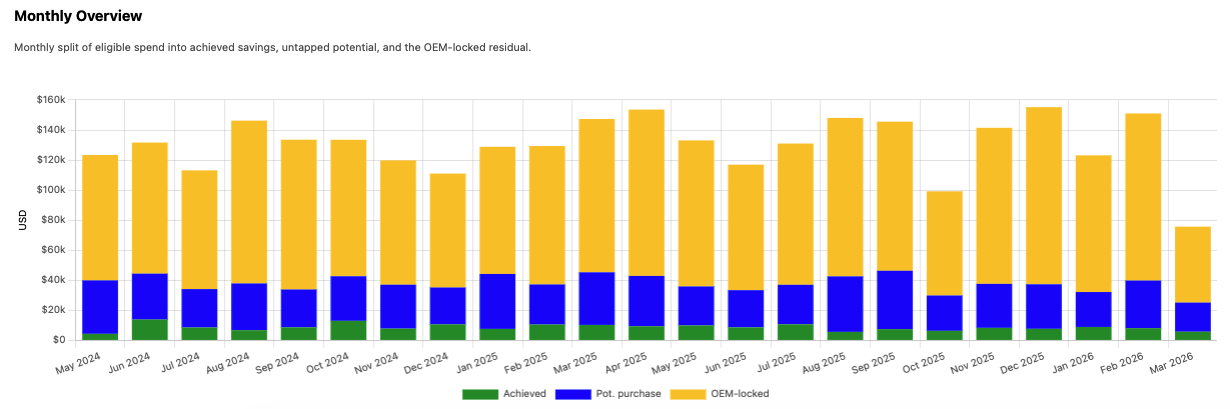
Monthly split of eligible spend into achieved savings, untapped potential, and the OEM-locked residual.
Top opportunities
The top opportunities table lists the OEM part numbers with the largest per-event PMA savings still on the table, ranked by total capturable savings (per-event savings × number of OEM events). The table is paginated at 10 rows per page. Columns:
- Rank:
Position in the list (1 = largest capturable savings).
- OEM PN:
OEM part number.
- Description:
Static enrichment from the master data.
- PMA PN:
The cheapest registered PMA replacement for this OEM (by SV FMV).
- Avg. OEM Price:
OEM purchase spend on this PN divided by the number of OEM purchase events in the window.
- # events:
Number of OEM purchase events on this PN within the window.
- PMA FMV:
Lowest PMA FMV available at the SV condition.
- Potential savings:
Avg. OEM Price − PMA FMV, clamped at zero. Represents the savings achievable on a single future purchase if the airline switched to the cheapest PMA.
- %:
Potential savings as a share of Avg. OEM Price.
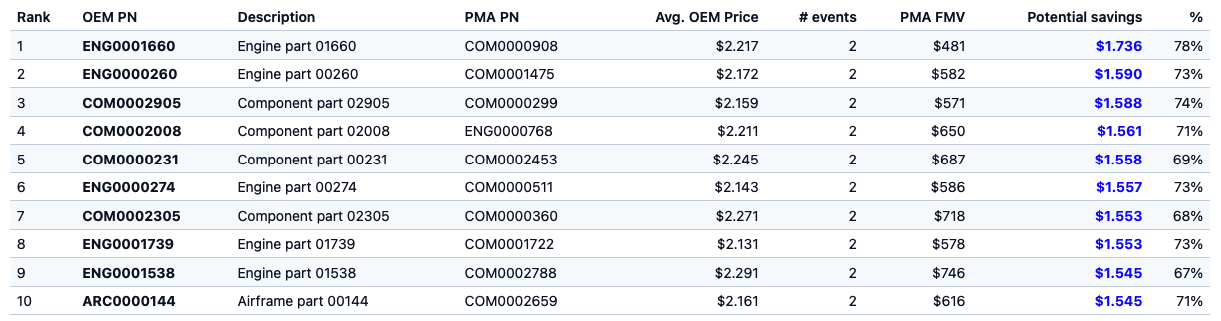
Top opportunities ranked by total capturable savings.