Search
The search component lets you evaluate a single part number. The results combine technical attributes, market activity, and repair-relevant data from the IATA MRO SmartHub Evaluator database.
Part search
To evaluate a single material, start typing the part number in the search field. After three characters a suggestion list appears.
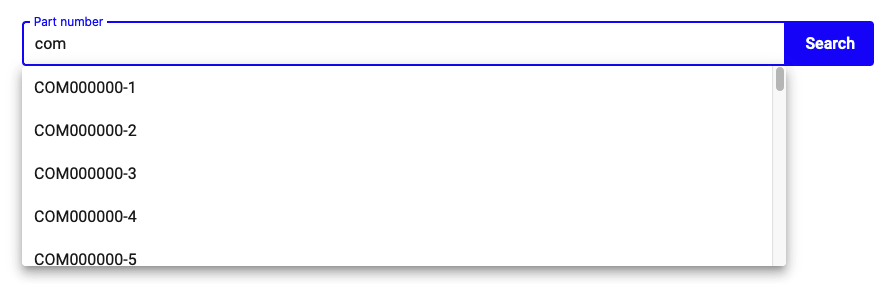
Part number search with suggestion list
Press Enter or click “Search” to start the evaluation. Results are shown once the data has been collected.
Evaluation results
The results page is divided into four sections:
- Overview:
General and technical attributes of the selected part.
- Market Activity:
Market values (FMV, MPV, MSV) plus average market price, transaction history, price ranges and availability.
- Repair:
Workshop event statistics, scrap rate and lead times.
- FMV:
FMV calculation methodology, quality dimensions and historic development.
Quality, liquidity and risk chips
The top of the results page shows three coloured chips that summarise how confident the platform is in the values displayed for this part:
FMV Quality — High, Medium or Low (see FMV Quality scorecard).
Liquidity — based on the number of recent transactions: High (≥20), Medium (≥5), Low (<5).
Risk — derived from the historic scrap rate for this part. High risk indicates a scrap rate above 25%.
Next to these, a row of attribute chips highlights properties of the part that affect handling, valuation or sourcing:
Repairable — the part can be repaired; AR/US transactions can be normalised back to SV.
Life Limited — the part is life-limited (LLP).
Back-to-Birth — full traceability is required.
Hazard — the part is classified as hazardous material.
Can Contain Kerosine — the part may contain residual kerosine and requires special handling.
Overview
The Overview section provides general and technical details for the selected part: manufacturer, ATA chapter, material domain, aircraft type, interoperabilities, modifications, and PMA alternatives. PMA information is sourced from the FAA PMA database.
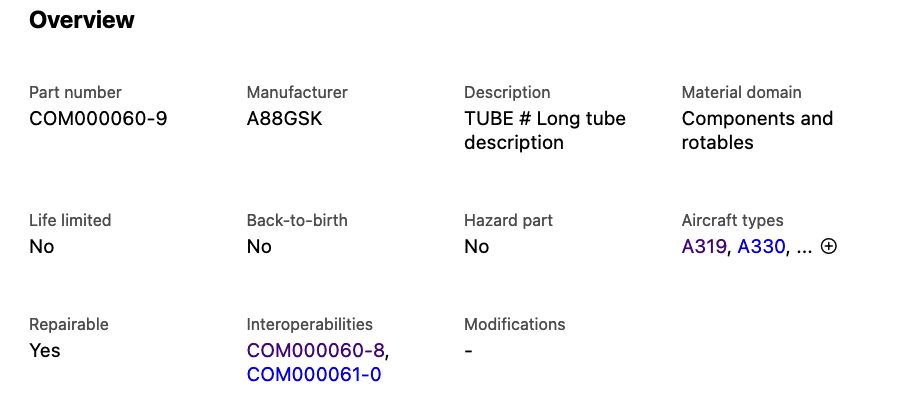
General and technical overview
Note
Where data is shown as a link (blue font), additional information is reachable by clicking it.
Market Activity
The Market Activity section opens with a Price Summary matrix that shows the four market values side by side per condition:
Column |
Meaning |
See |
|---|---|---|
FMV |
Fair Market Value — the strategic, neutral value. |
|
MPV |
Market Purchase Value — lower bound of the typical market price corridor. |
|
MSV |
Market Sales Value — upper bound of the typical market price corridor. |
|
AVG |
Average market price across the last 12 months of transactions in this condition. |
For Components & Rotables (CRT) parts, conditions NE, OH, SV, AR and US are shown. For Consumables & Expendables (CUE) parts, only NE and NS are shown.
Note
When AR-condition FMV is negative — i.e. the expected repair cost exceeds the SV value — the part is flagged as BER (Beyond Economical Repair). The platform indicates this with an icon next to the AR FMV value.
Below the price matrix, the transaction graph visualises every historical transaction for the selected material. Each point carries condition, price and date; hovering reveals the details.
Data your company has contributed is shown as filled points; anonymised external transactions appear as hollow points. Use the controls on the left to overlay interoperabilities or filter by condition.
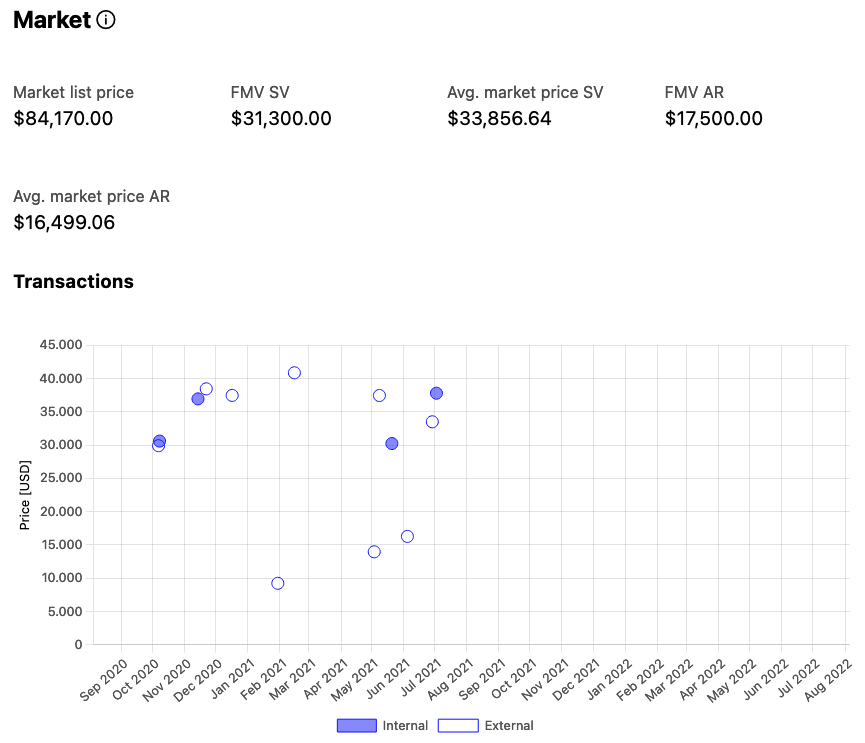
Market analysis — price summary & transaction graph
The “Price range” and “Availability” graphics aggregate the same transaction data to give a quick view of pricing dispersion and availability per condition.
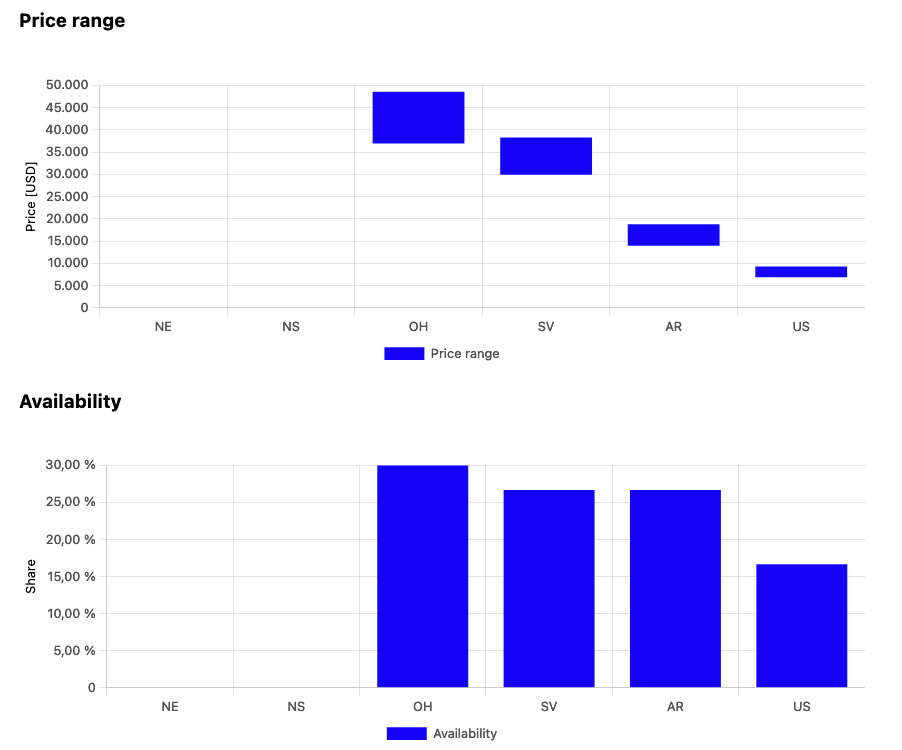
Market analysis — price range & availability
Repair
The Repair section visualises workshop events for the selected material. The summary row shows:
Average repair price — average price across workshop events of the last 24 months whose post-event condition was SV.
Scrap rate — share of workshop events for this part where the part could not be repaired and was scrapped.
Lead time — repairs — average duration (days) of workshop events whose post-event condition was SV (turn-around time).
The workshop event graph below visualises the historical data point by point. Filled points are your company’s contribution; hollow points are anonymised external data. Use the controls on the left to add interoperabilities or filter by pre-/post-event condition.
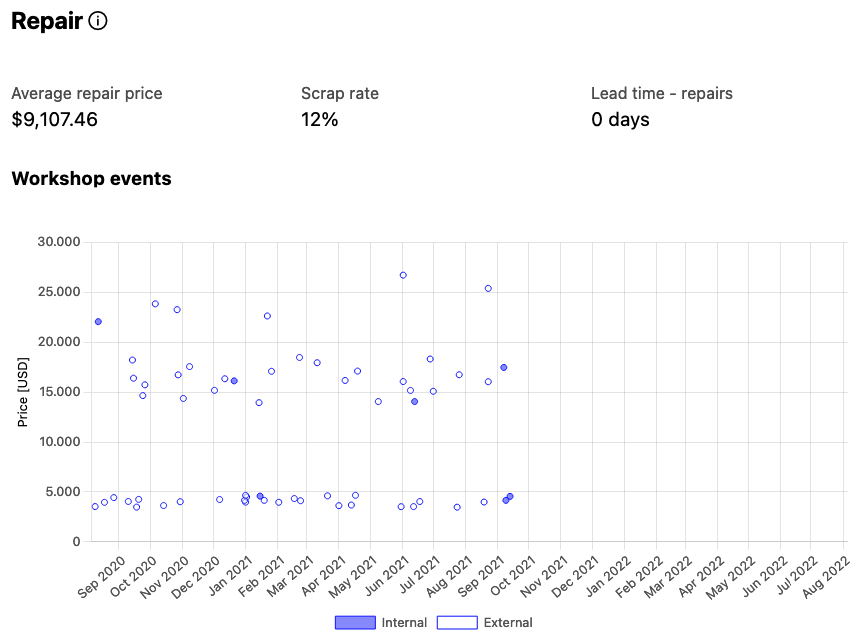
Repair analysis — KPI & event graph
The “Event price range” and “Event distribution” graphics aggregate the event data to give a quick view of pricing dispersion and the share of event categories.
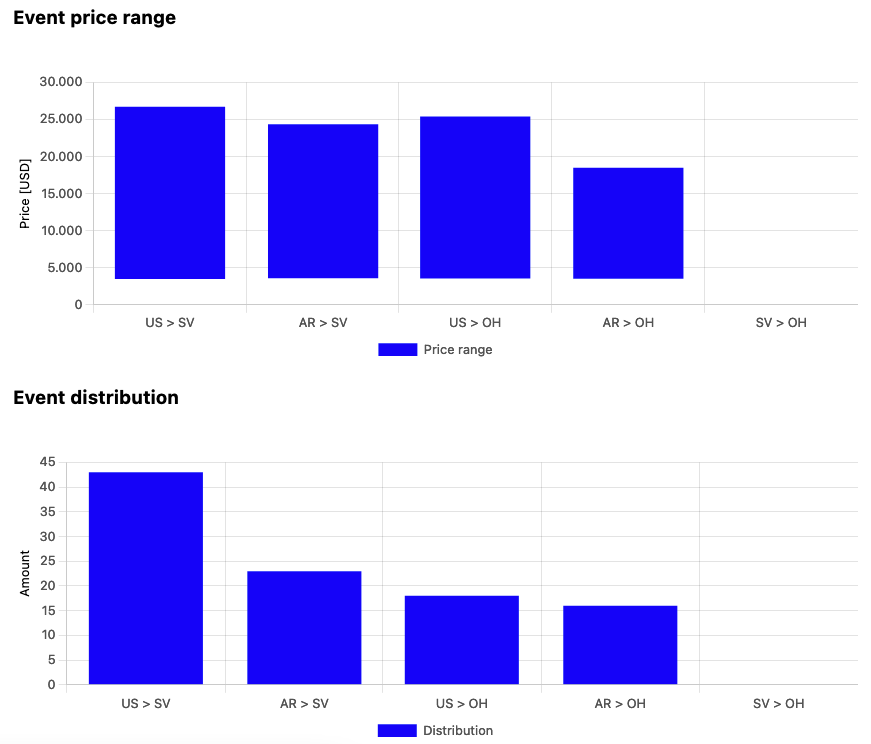
Repair analysis — event price range & event distribution
FMV
The FMV section provides details about how the current FMV was calculated, how confident the platform is in it, and how it has evolved.
FMV stage [X] — the calculation stage applied for this material in this condition (see FMV definition & algorithm).
FMV quality — High / Medium / Low scorecard combining data basis, freshness and price consistency. See FMV Quality scorecard for the calculation rule.
Used data points — number of transactions used for the current FMV calculation. A dash is shown for stages that are not based on transactions.
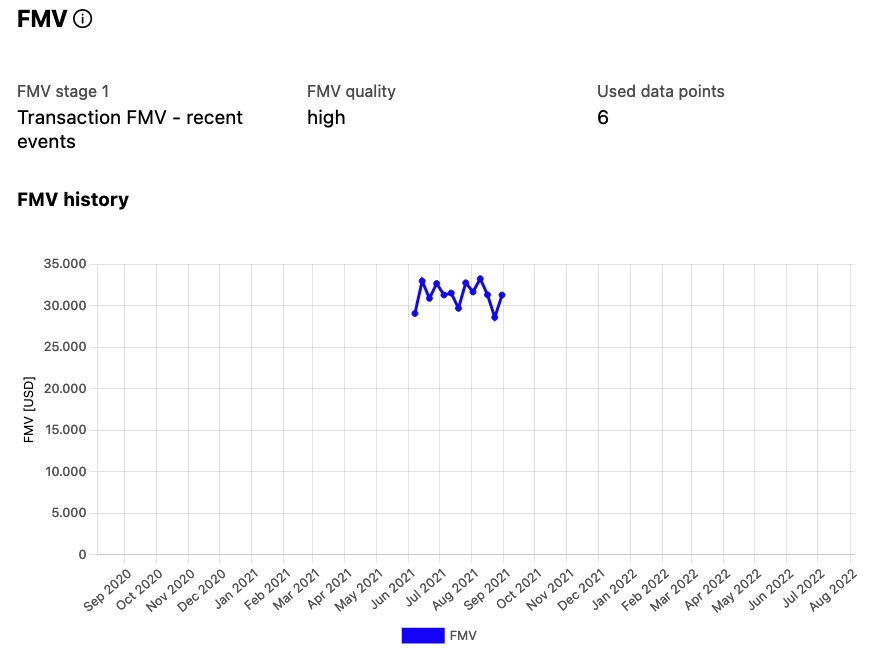
FMV details — calculation, data quality, and history
The FMV history graph shows previous calculation cycles. Hover any point to see stage, condition and value at that snapshot.