Evaluator — Pricing parts and lists
Welcome to the Evaluator on IATA MRO SmartHub. This tutorial walks through the typical workflows: evaluating a single part, evaluating a complete material list, validating a purchase quote, and (for company administrators) calibrating MPV/MSV for your company.
The Evaluator was redesigned in May 2026 with a new price summary matrix (FMV, MPV, MSV, AVG), an FMV Quality scorecard, and an updated material list view. If you are returning after May 2026, the Evaluate a single part section below is the best starting point.
For conceptual background, see Market values: FMV, MPV & MSV (FMV, MPV, MSV) and FMV definition & algorithm (algorithm). For the full release notes, see the change log inside IATA MRO SmartHub.
Getting started
Open a browser and visit https://mrosmarthub.iata.org. Accounts
are personalised; your username appears in your registration email
and is not the same as your email address. If you cannot locate
it, contact your internal administrator or IATA Support
(How to contact IATA?).
To use the Evaluator, your account needs the Evaluator authorisation. If the Evaluator entry is missing from the top navigation, please ask your administrator to grant access.
Workflow 1 — Evaluate a single part
Use this workflow whenever you need to understand the market for a specific part number.
From the top navigation, open Evaluator → Search.
Start typing the part number. After three characters a suggestion list appears. Select the part and press Enter (or click “Search”).
The results page opens with four sections: Overview, Market Activity, Repair, and FMV.
Read the chips at the top first
Three coloured chips summarise how confident the platform is in the values shown for this part:
FMV Quality — High, Medium or Low. A High chip means the FMV is supported by recent transaction data and that the FMV sits consistently between MPV and MSV across conditions.
Liquidity — High (≥ 20 recent transactions), Medium (≥ 5), Low (< 5). Lower liquidity means the values are based on a thinner market.
Risk — derived from the historic scrap rate. High risk means the part has a scrap rate above 25% in workshop events.
Next to these you will see attribute chips: Repairable, Life Limited, Back-to-Birth, Hazard, Can Contain Kerosine. A filled chip means the attribute applies to this part.
Read the Price Summary matrix
Inside the Market Activity section, the Price Summary matrix shows four values per condition:
FMV — strategic, neutral value.
MPV — Market Purchase Value, the lower bound of the corridor.
MSV — Market Sales Value, the upper bound of the corridor.
AVG — average market price across the last 12 months in this condition.
If the AR row shows a “BER” indicator, the expected repair cost exceeds the SV value: the part is Beyond Economical Repair in AR condition and is unlikely to be worth buying for repair.
For Components & Rotables, conditions NE, OH, SV, AR and US are shown. For Consumables & Expendables, only NE and NS are populated.
Drill into the transaction graph
Below the matrix, the transaction graph shows every historical transaction for the part. Filled points are your company’s contributed data; hollow points are anonymised external transactions. Use the controls on the left to overlay interoperabilities or filter by condition. Hover any point to see details.
Workflow 2 — Evaluate a complete material list
Use this workflow when you need to evaluate a package, an inventory, or a stock list.
From the top navigation, open Evaluator → Lists.
To create a new list, click Create list. The dialog asks for a list name, an optional partner company, and a CSV file with the parts. A template is downloadable from the dialog.
The minimum CSV columns are: part number, manufacturer, condition, quantity, unit, and price in USD (≥ 1 USD). The price you provide is kept alongside the market values so you can compare your reference (offer, minimum bid, book value) against the market.
After upload, the contents are summarised for review. Confirm to create the list.
Read the list summary
Open a list from the overview to see two header tables:
Market Prices — Total MPV, Total MSV, Total avg market price.
Volume & Valuation — Items, Quantity, Total price (your upload reference), Total FMV.
At the top of the page, two chips show the Data Quality and FMV coverage for the list as a whole. FMV coverage is the share of parts in the list for which an FMV in the requested condition is available; aim for at least 80%.
Three distribution charts visualise the composition of the list: condition, material domain (CRT vs CUE), and FMV stage. A list with a high share of stages 1–4 is well-supported by transaction data; a list with a high share of stages 5+ leans on fall-back valuations.
Drill into individual parts
The part-level table at the bottom shows every uploaded line with FMV, MPV, MSV and 12-month average market price. Use the global search to filter by part number, the condition filter to narrow by part condition, and column headers to sort. Click the plus icon to expand the part details, or click the part number to open the single-part evaluation in Search.
Workflow 3 — Validate a purchase quote
Use this workflow when you have a supplier quote and want to know whether the price is fair against the market.
From the top navigation, open Evaluator → Decision Support → Price validation.
Enter part number, condition, and the price (USD) you want to validate.
Click Validate Price.
The results page shows a traffic-light price indication, a quantile-based market price chart, and a list of alternative sourcing strategies (Connector listings, Asset Manager listings, AR + repair, AR + overhaul). For the full reading guide, see Purchase Price Validation.
Note
Price validation is shown in full detail only when an applicable FMV with stage 1–4 is available for the entered condition. For parts where the FMV is based on fall-back stages (5+), the indication may be hidden or simplified. The FMV Quality chip on the single-part evaluation is the best leading indicator for whether validation will be useful.
Workflow 4 — Find a sales price
Use this workflow when you are on the selling side and need to decide at what price to list, quote, or offer a part. The Sales Price Finder produces a pricing corridor — from a break-even floor to an AOG premium — based on FMV, market transactions, and (if configured) your company’s own Minimum Sales Price and margin settings.
From the top navigation, open Evaluator → Decision Support → Sales Price Finder.
Enter the part number and the material condition you intend to sell in. Optionally enter a serial number — the system will then check for any serial-specific pricing rules your company has configured.
Click Find Price (or press Enter).
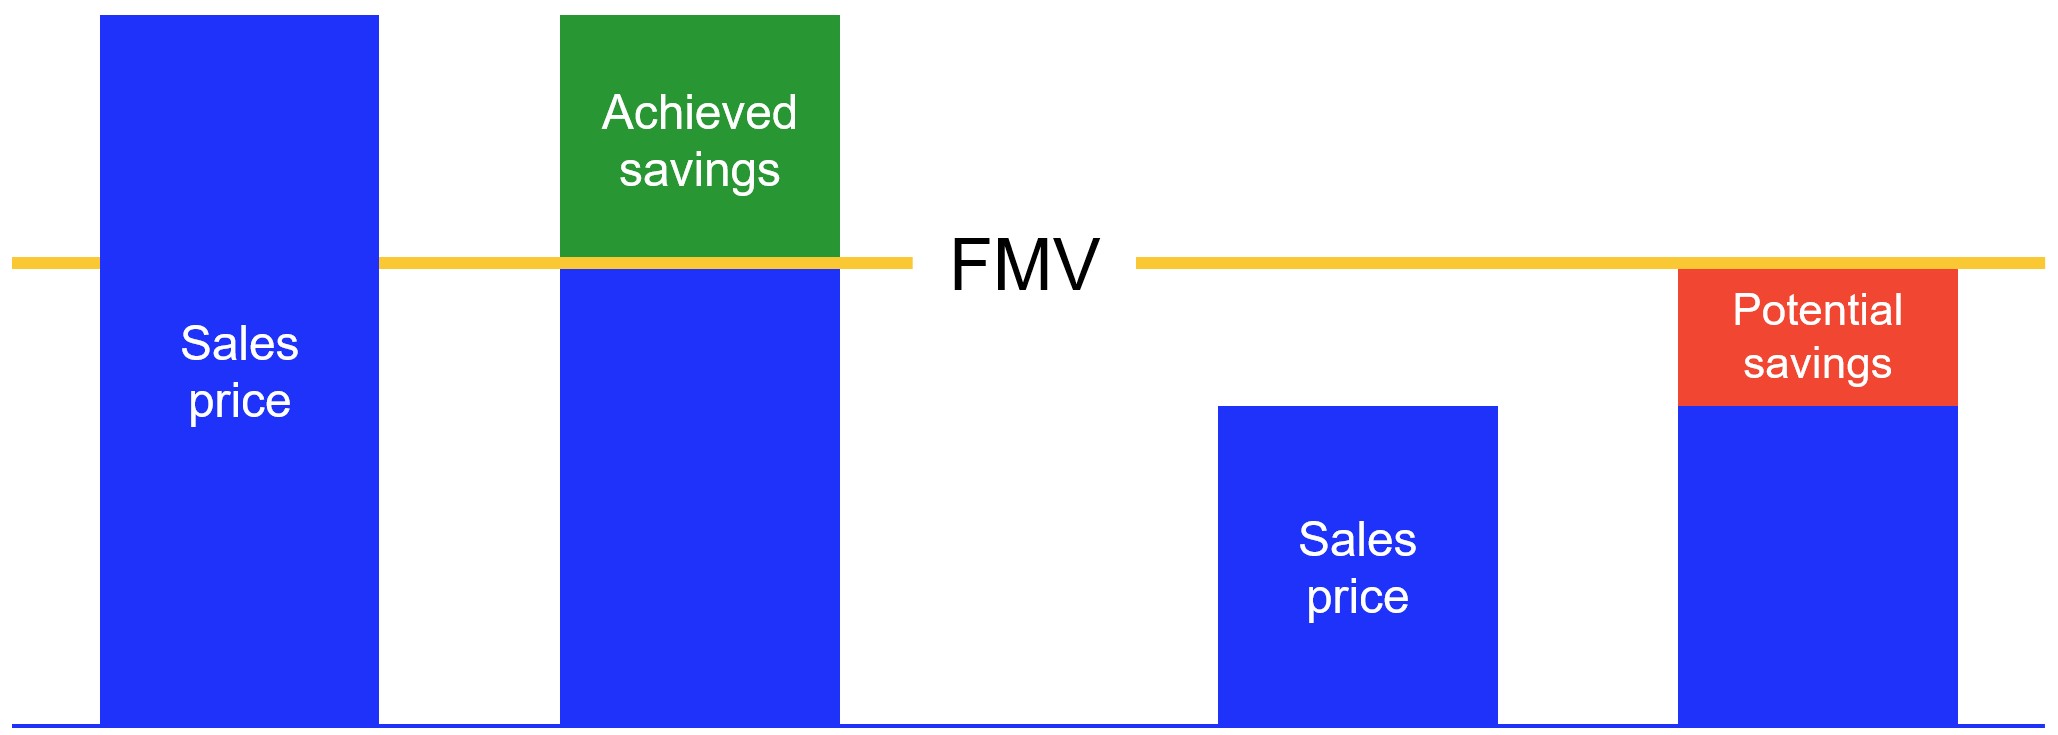
Selling above the FMV realises achieved savings; selling below it leaves potential savings on the table.
Read the quality chips first
Two chips at the top of the results tell you how much to trust the numbers:
FMV Quality — High (stage 1–2), Medium (stage 3–4) or Low (stage 5+). A Low chip means the underlying FMV is a fallback and the corridor should be treated as directional only.
Liquidity — High, Medium or Low based on the number of recent transactions. Low liquidity means the corridor is inferred from a thin market.
For consumables and expendables (CUE) a notice reminds you that FMV data is limited by design.
Read the pricing corridor
Four price cards are shown side by side. Read them left to right as the range you can legitimately quote in:
Break-Even Price — the floor. Selling below this loses money against the Minimum Sales Price (if configured) or against the FMV.
Minimum Offer — the lowest recommended offer. Derived from your company’s sales margins if configured, otherwise from industry factors.
Opening Price — the recommended starting price for negotiation. Highlighted in the UI — this is the primary recommendation.
AOG Price — the premium price for Aircraft-on-Ground demand, capped at the 90th percentile of the market to stay realistic.
The margins that shape the corridor are resolved through a four-tier fallback, in order of priority:
A serial-specific rule for this exact PN/serial/condition.
A part-level rule for this PN/condition (any serial).
A condition-specific company default — e.g. “for any OH part, use these margins”.
A company-wide default — the baseline your company wants applied when no more specific rule exists.
If none of the four tiers supplies a value, the corridor falls back to industry factors derived from the IATA MRO SmartHub community database. Each tier fills only the values the higher tiers left blank — a partial per-part rule does not block the company defaults from filling the remaining fields.
To calibrate the corridor for your company, see Company Settings. For the full breakdown of the resolution order, see How the corridor is resolved.
Sanity-check against the market landscape
Below the cards, the market price landscape chart plots the corridor against the distribution of historical transaction prices. Prices in the green area are below the 10th percentile, prices in the red area are above the 90th, and the grey band is the average zone. Reference lines show the FMV and the 6- and 12-month average transaction prices. If your Opening Price sits deep in the red zone, expect pushback; if it sits deep in the green zone, you are likely leaving money on the table.
For the full field-by-field reference of every card, chart and table on the results screen, see Sales Price Finder.
Workflow 5 — Calibrate MPV / MSV (administrators)
Use this workflow if you are a company administrator and want the MPV/MSV corridor to reflect your company’s procurement context.
Open Settings → Company → Evaluator in the top-right user menu.
Adjust the parameters:
Min spread — minimum width of the corridor (default
0.10= 10%).Max spread — maximum width of the corridor (default
0.40= 40%).Spread override — optional fixed spread that bypasses the IQR-based calculation.
Click Save.
Note
Changes take effect with the next scheduled calculation on the 1st of the following month — they do not retroactively rewrite past values. The “Last updated” indicator shows when the values were last changed and by which user.
A wider spread means more parts will be flagged as price-consistent in the FMV Quality scorecard but the corridor loses resolution. A narrower spread is more discriminating but may surface more inconsistencies. The defaults are calibrated for the majority of parts.
For the full settings page, see Company Settings.
Where to go next
Market values: FMV, MPV & MSV — concept overview of FMV, MPV, MSV and the FMV Quality scorecard.
Search — full reference for the single-part evaluation.
Lists — full reference for the material list evaluation.
FMV definition & algorithm — FMV calculation methodology.
FMV 2026 — Methodology deep-dive — methodology deep-dive (recency weighting, IQR-based spread, factor calibration).