Statistics
The statistics screen provides an overview of material that is available for purchase/exchange on IATA MRO SmartHub and own material that is offered for sale/exchange. The overall structure, the KPIs, and the visualizations is the same for foreign material, own material, and company details. Therefore the different components are documented only once.
Timeline
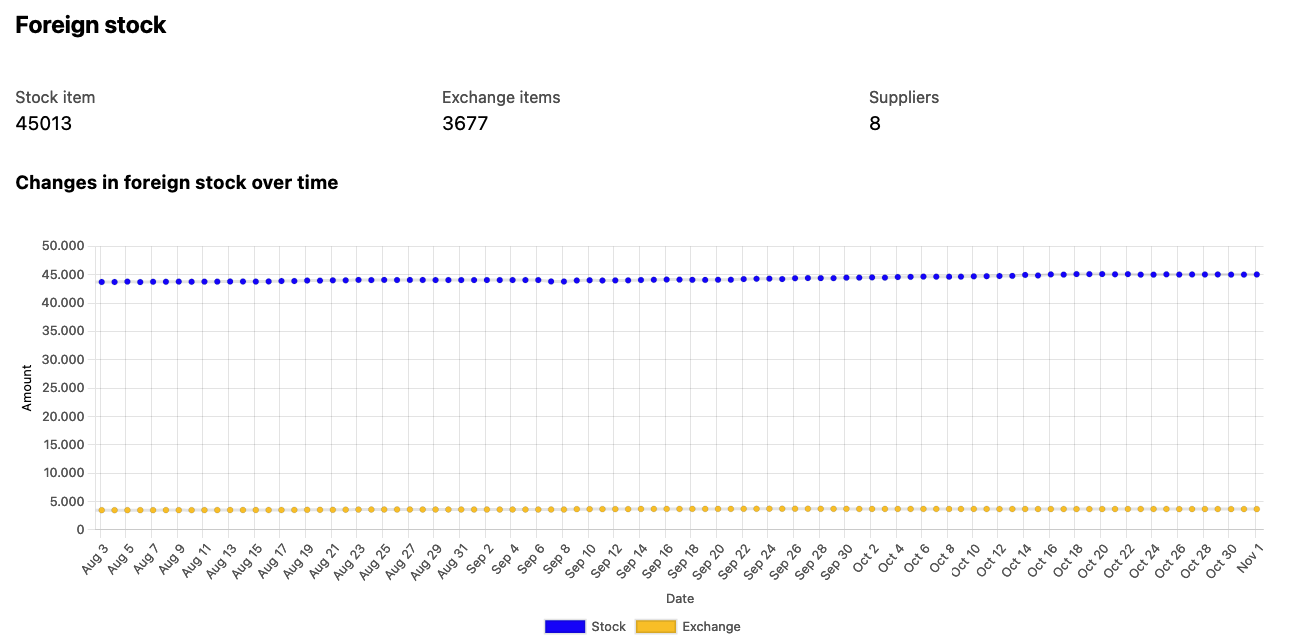
The first graph for each section shows a history of the available listings volume on a daily basis. The blue line represents listings for outright sales and the yellow line shows the daily volume for exchange listings.

Timeline of listings volume on a daily basis
The visualization of the history goes back 90 days.
Material categories
The second part of each section shows aggregated graphics for the listings based on material condition and material domain.

Summary of listings based on material type and condition
Supplier/Customer details
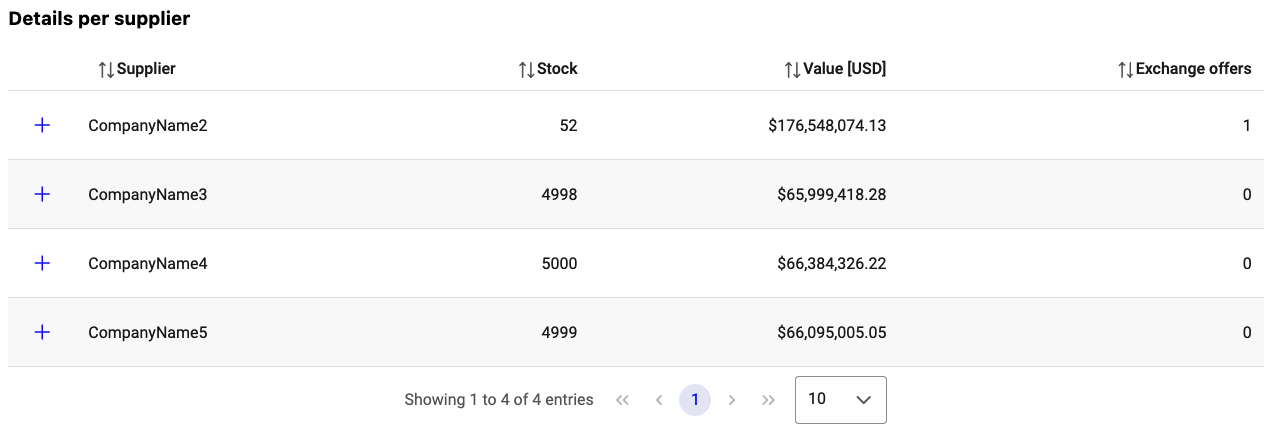
Underneath the material categories statistics, a table details similar KPI on a company (supplier or customer) level. Clicking on the plus sign in the first column opens the details for the selected company.

Details of listings for a selected company